Shall we dive straight in? Institutional racism in UK academia is very obvious when you consider that every year since records began, Black people have represented less than 1% of professors despite the fact that Black undergraduates are approximately 8% of the student population. This is commonly referred to as the broken pipeline where very few Black students transition into the most senior academic role. This can be contrasted with 72% of UK undergraduates being white and this figure inflates to 81% at the professorial stage. HESA released data this year that finally separated University staff by sex and ethnicity. I had requested this data last year but was quoted an astronomical price for an independent researcher, so imagine my delight!
I am still poring over the data, I did however want to start sharing it with you, for your information and definitely, to get your insights on it too. It is going to be a series! I am starting today with who gets promoted and who doesn't (spoiler alert: if you have been paying attention, you already know the answer!), and will progress to looking at that broken pipeline.
As a general note, I have used the language and terminology from the HESA data to allow cross-referencing. I am also not correcting the errors that I found with the HESA data and have used the figures that they have provided.
The 5 minute short story of today's data
1. White professors (male and female) significantly outnumber all other groups.
2. White women professors have increased every year since 14/15 and overtook white male professors in terms of the absolute number increase between 20/21 and 21/22 with promotions for 345 white women professors vs 90 for white men professors in that time period.
3. White men professors also increased every year trend except 17/18 and 20/21. This may be the only group to perhaps reflect a Brexit exodus (this is a theory!) with 190 less white male professors between 19/20 and 20/21.
3. Within the non-white groups, Asian professors (female and male) significantly outnumber and outpace the growth of all other groups.
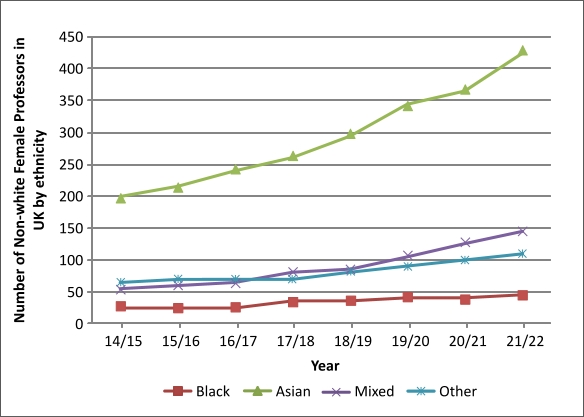
4. Within the non-white groups, Black professors (female and male), are the least promoted group numerically. If data is normalised Black women professors appear as the 3rd fastest growing group (after Mixed and Asian ethnicities), but this is numerically a change from 25 professors in 14/15 to 45 professors in 21/22. This represents an increase of 20 professors over an 8 year period which is the lowest increase amongst all other groups (male, female, all ethnicities).
The Story in Graphs
The UK female professor most likely to be promoted is white
Looking at the data for female professors, there are several thousands more white female professors in UK compared to any other ethnicity in that category. If placed on the same scale,the data of all other ethnicities are so suppressed numerically that they appear to be not increasing over time.
This is, however, not an accurate picture as the inset in the graph shows. Omitting the white group introduces a new scale that depicts some growth in the number of professors of non-white ethnicities, especially for the Asian group. (I will let you digest the implications of manipulating the data in this way, why do we need a separate racialised scale?)
White male professors in UK are substantially greater in number than any other ethnicity or gender
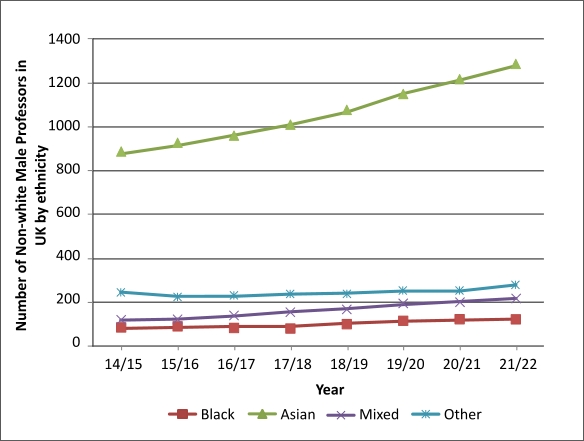
The largest slice of the academic professorial cake belongs to white men in UK. They easily outnumber the second largest group which is white women professors (A UK total of 13255 white men vs 5865 white women for 21/22). Within the male group, much like the female group statistics, the data for white male professors suppresses the data for the non-white ethnicities and it is again necessary to consider the non-white ethnicities on their own. The white male professor group is the only group to have a significant decrease in professor numbers between two data collection points. This happened between 19/20 and 20/21 when numbers decreased by 190 from 13355 to 13165. I theorise that this may be linked to Brexit as the general trend across all groups has been a net increase in professorships over time, so it is unusual to have a decrease of this size.

Within the non-white ethnicities, Asian professors are the largest and most steadily increasing group. Much like the data for women professors, Black men professors are the least likely to be promoted, and there is a small difference between the starting figure of 80 professors in 14/15 and 125 in 21/22
The road ahead : Define the scale
White women professors followed by Asian men and women professors are the groups that are seeing the greatest relative increases over time. It is also interesting to note that white male professors group appears only to have been slowed down during 2017/18 and experienced an actual attrition between 19/20 and 20/21 which time well with the Brexit vote and actual Brexit.
Black men and women professors remain hugely under-represented. The relative increase for Black women professors (near doubling over 8 years), does not tell the full story. In absolute numbers, for Black women professors, the increase of 20 individuals over 8 years is the lowest numerically for any group (sex and ethnicity), the total number of Black women professors in 21/22 - 45 individuals - is also the smallest number for any group of professors. It is important in discussions of ethnicity to reference absolute numbers and not just percentages.
- I have used the term non-white for ethnicities that HESA classified separately from the white group.
- For the non-white ethnicities, all groups except the 'not known' category were selected. This is because the not known category could contain any person of any ethnicity who opted to not provide ethnicity data.
-Data errors exist within the data set provided by HESA. For example in 21/22, the total number of female professors is given as 6980 but adding up the individual ethnicity groups gives a number of 6985. I have used the individual ethnicity figures as provided and quoted the HESA totals instead of a corrected number that does not appear in the official figures.
HESA data - https://www.hesa.ac.uk/data-and-analysis/staff/chart-3
Broken Pipeline - https://leadingroutes.org/the-broken-pipeline
UK student ethnicity data - https://www.ethnicity-facts-figures.service.gov.uk/education-skills-and-training/higher-education/first-year-entrants-onto-undergraduate-degrees/latest


